
FORECAST SMARTER
Best Practices for Forecasting Amidst Volatile Trends and Consumer Uncertainty

Forecasting has always been challenging for businesses, but looking forward to 2023 comes with unprecedented layers of complexity, including:
Dramatic shifts in consumer interest in Sports & Outdoors
The impact of government stimulus checks
A pendulum swing to ecommerce
Extreme supply chain challenges
The possibility of a recession
As brands begin planning for 2023 and senior leaders ask for growth expectations, it’s no wonder many Brandrunners™ are scratching their heads.
Here at Netrush, we’re forecasting with our Sports & Outdoors brand partners by tapping into our deeply-rooted expertise in the category and our actionable data from the Amazon platform and the consumer. We’re kicking off our GEARING UP content series by sharing best practices and helpful data that Brandrunners can use to more confidently build forecasts in a dynamic and uncertain retail environment.
ADDRESSING THE NUANCES OF AMAZON
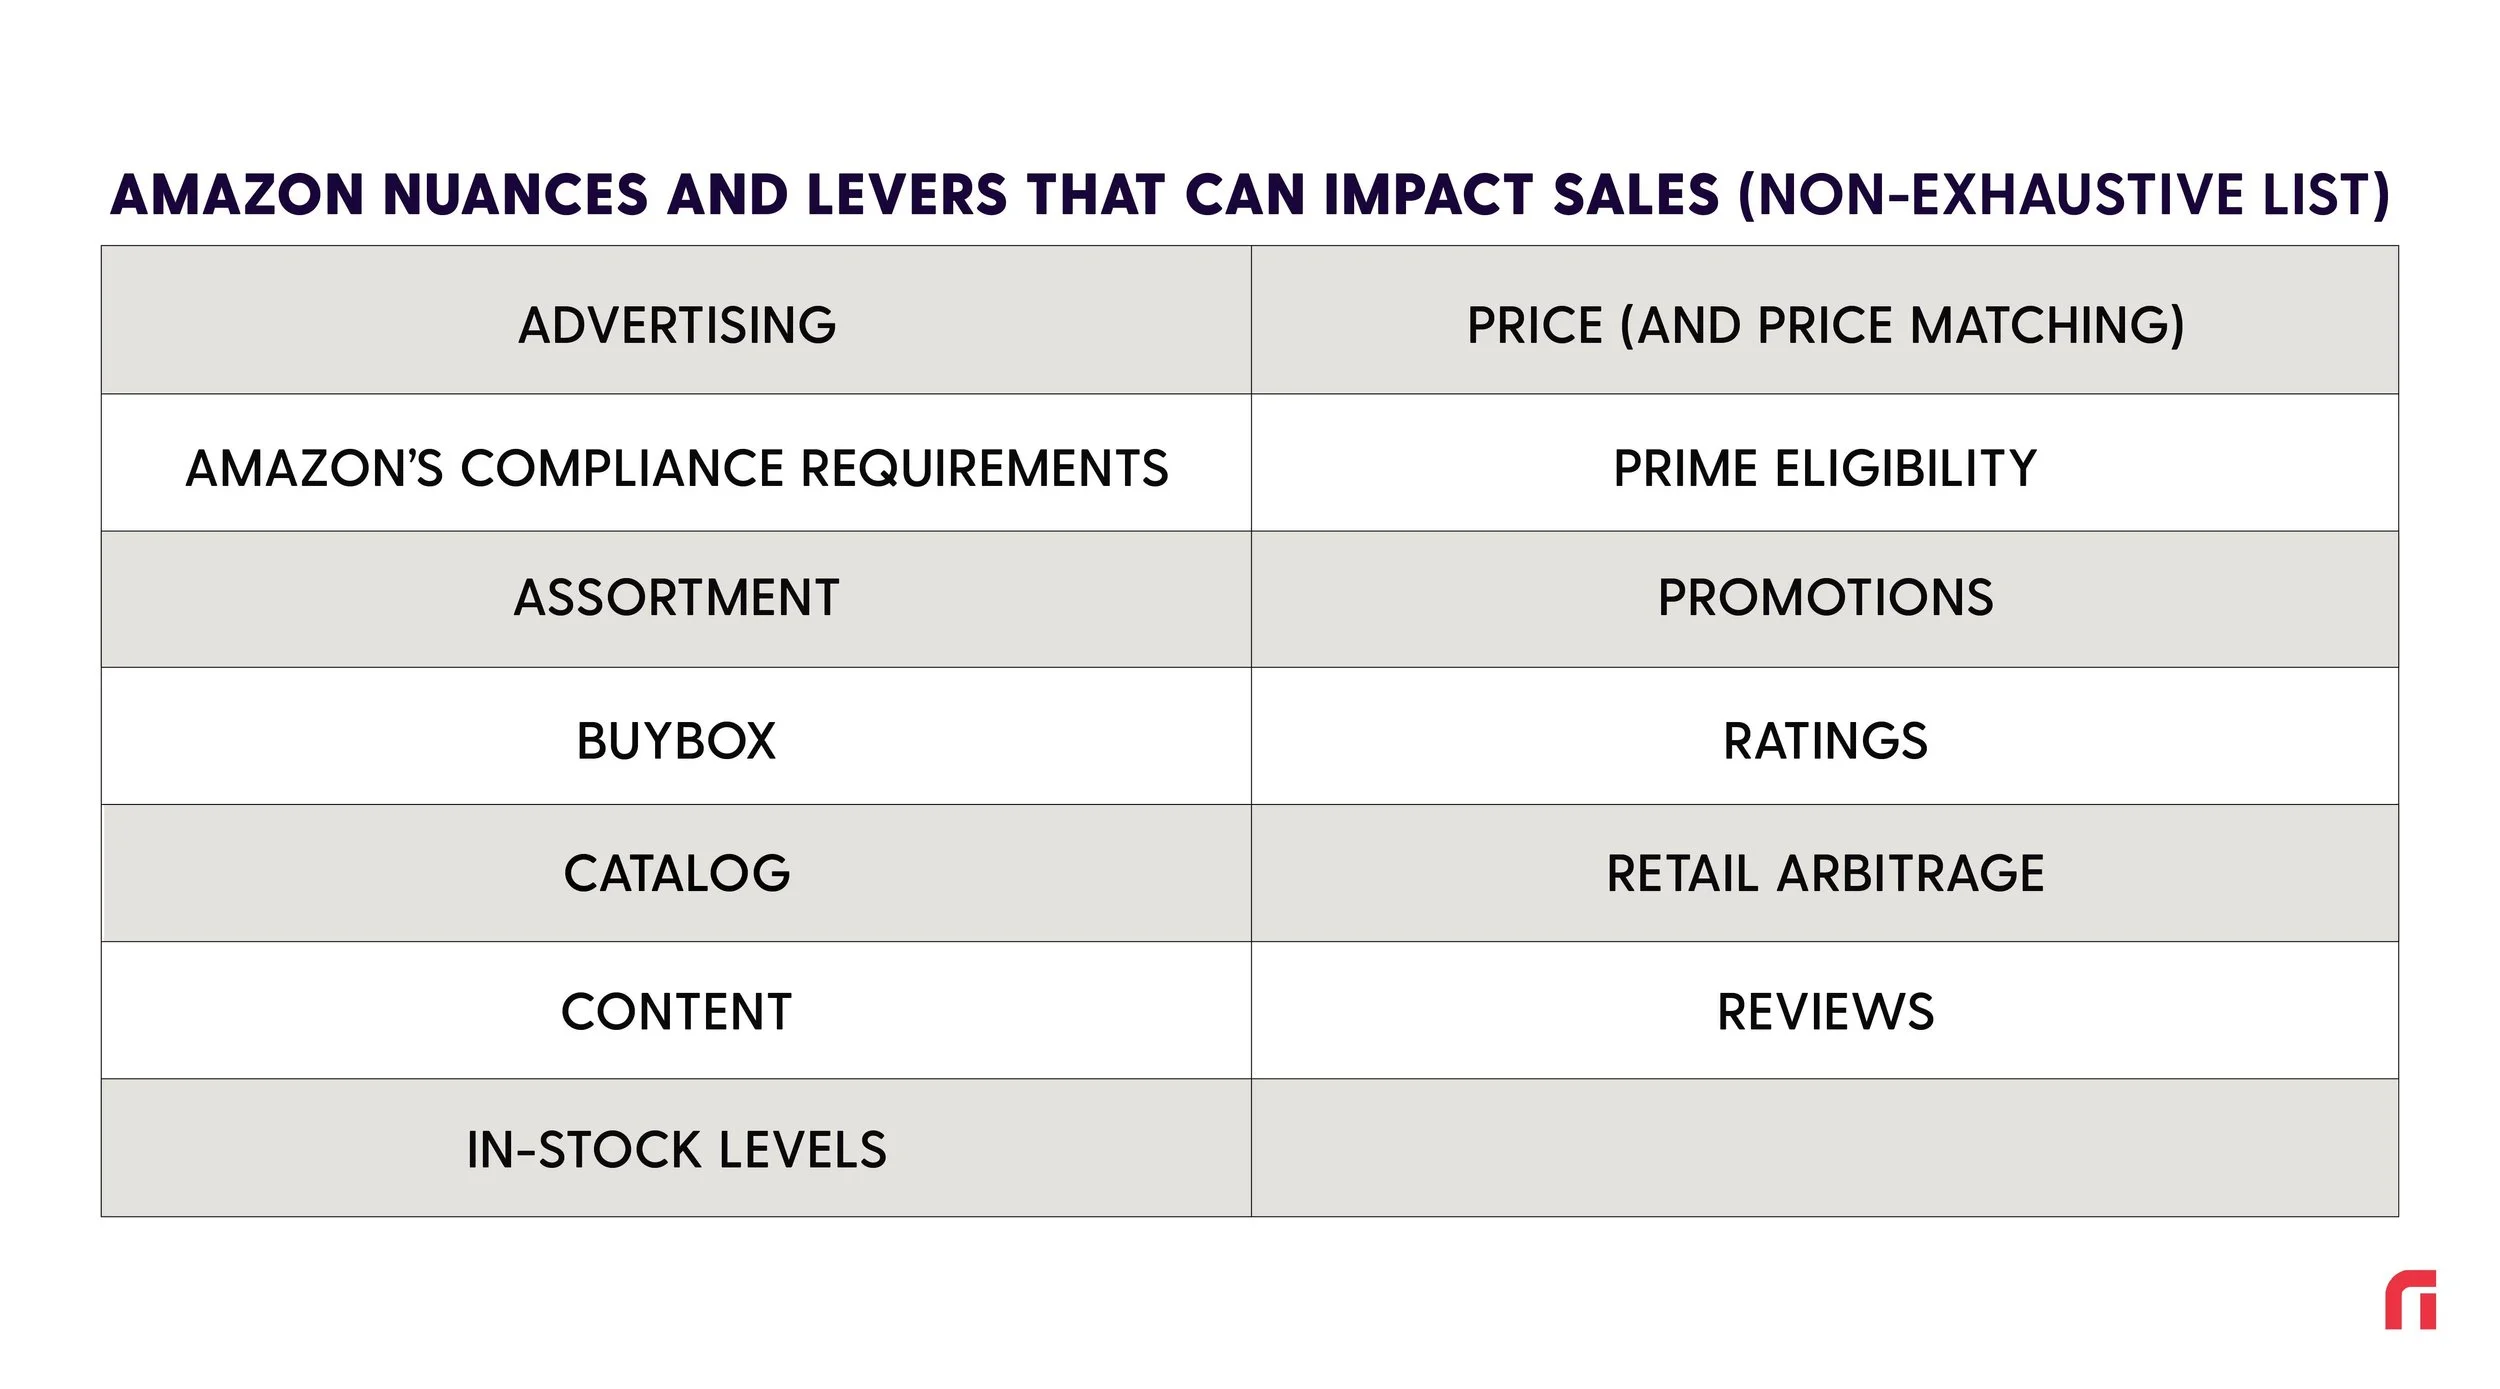
First, it’s important to note that there are many nuances to the Amazon business compared to the traditional B&M business. These nuances should be considered when building Amazon growth forecasts:
There are many variables impacting growth—either positively or negatively—on the Amazon platform, with varying levels of a brand ‘s control over each.
Whether the above impacts express themselves in the form of a dynamic competitive landscape, movements in organic ranking, or more, these variables can make forecasting for the digital business that much more complex, even on top of all the broad-based impacts referenced above.
All of the levers above ultimately fuel (or decelerate) the growth on Amazon, but the results don’t always come overnight. For example, while a new product launch may make a splash in B&M and serve as a significant tailwind for growth that quarter, the same launch on Amazon likely takes weeks or even months to establish history on Amazon, grow Amazon organic rank, and ultimately achieve meaningful sales. Similarly, a new and improved re-branding may have an immediate impact on B&M sales, but it will take time for the updated imagery and content on Amazon to fully trickle down to greater sales.
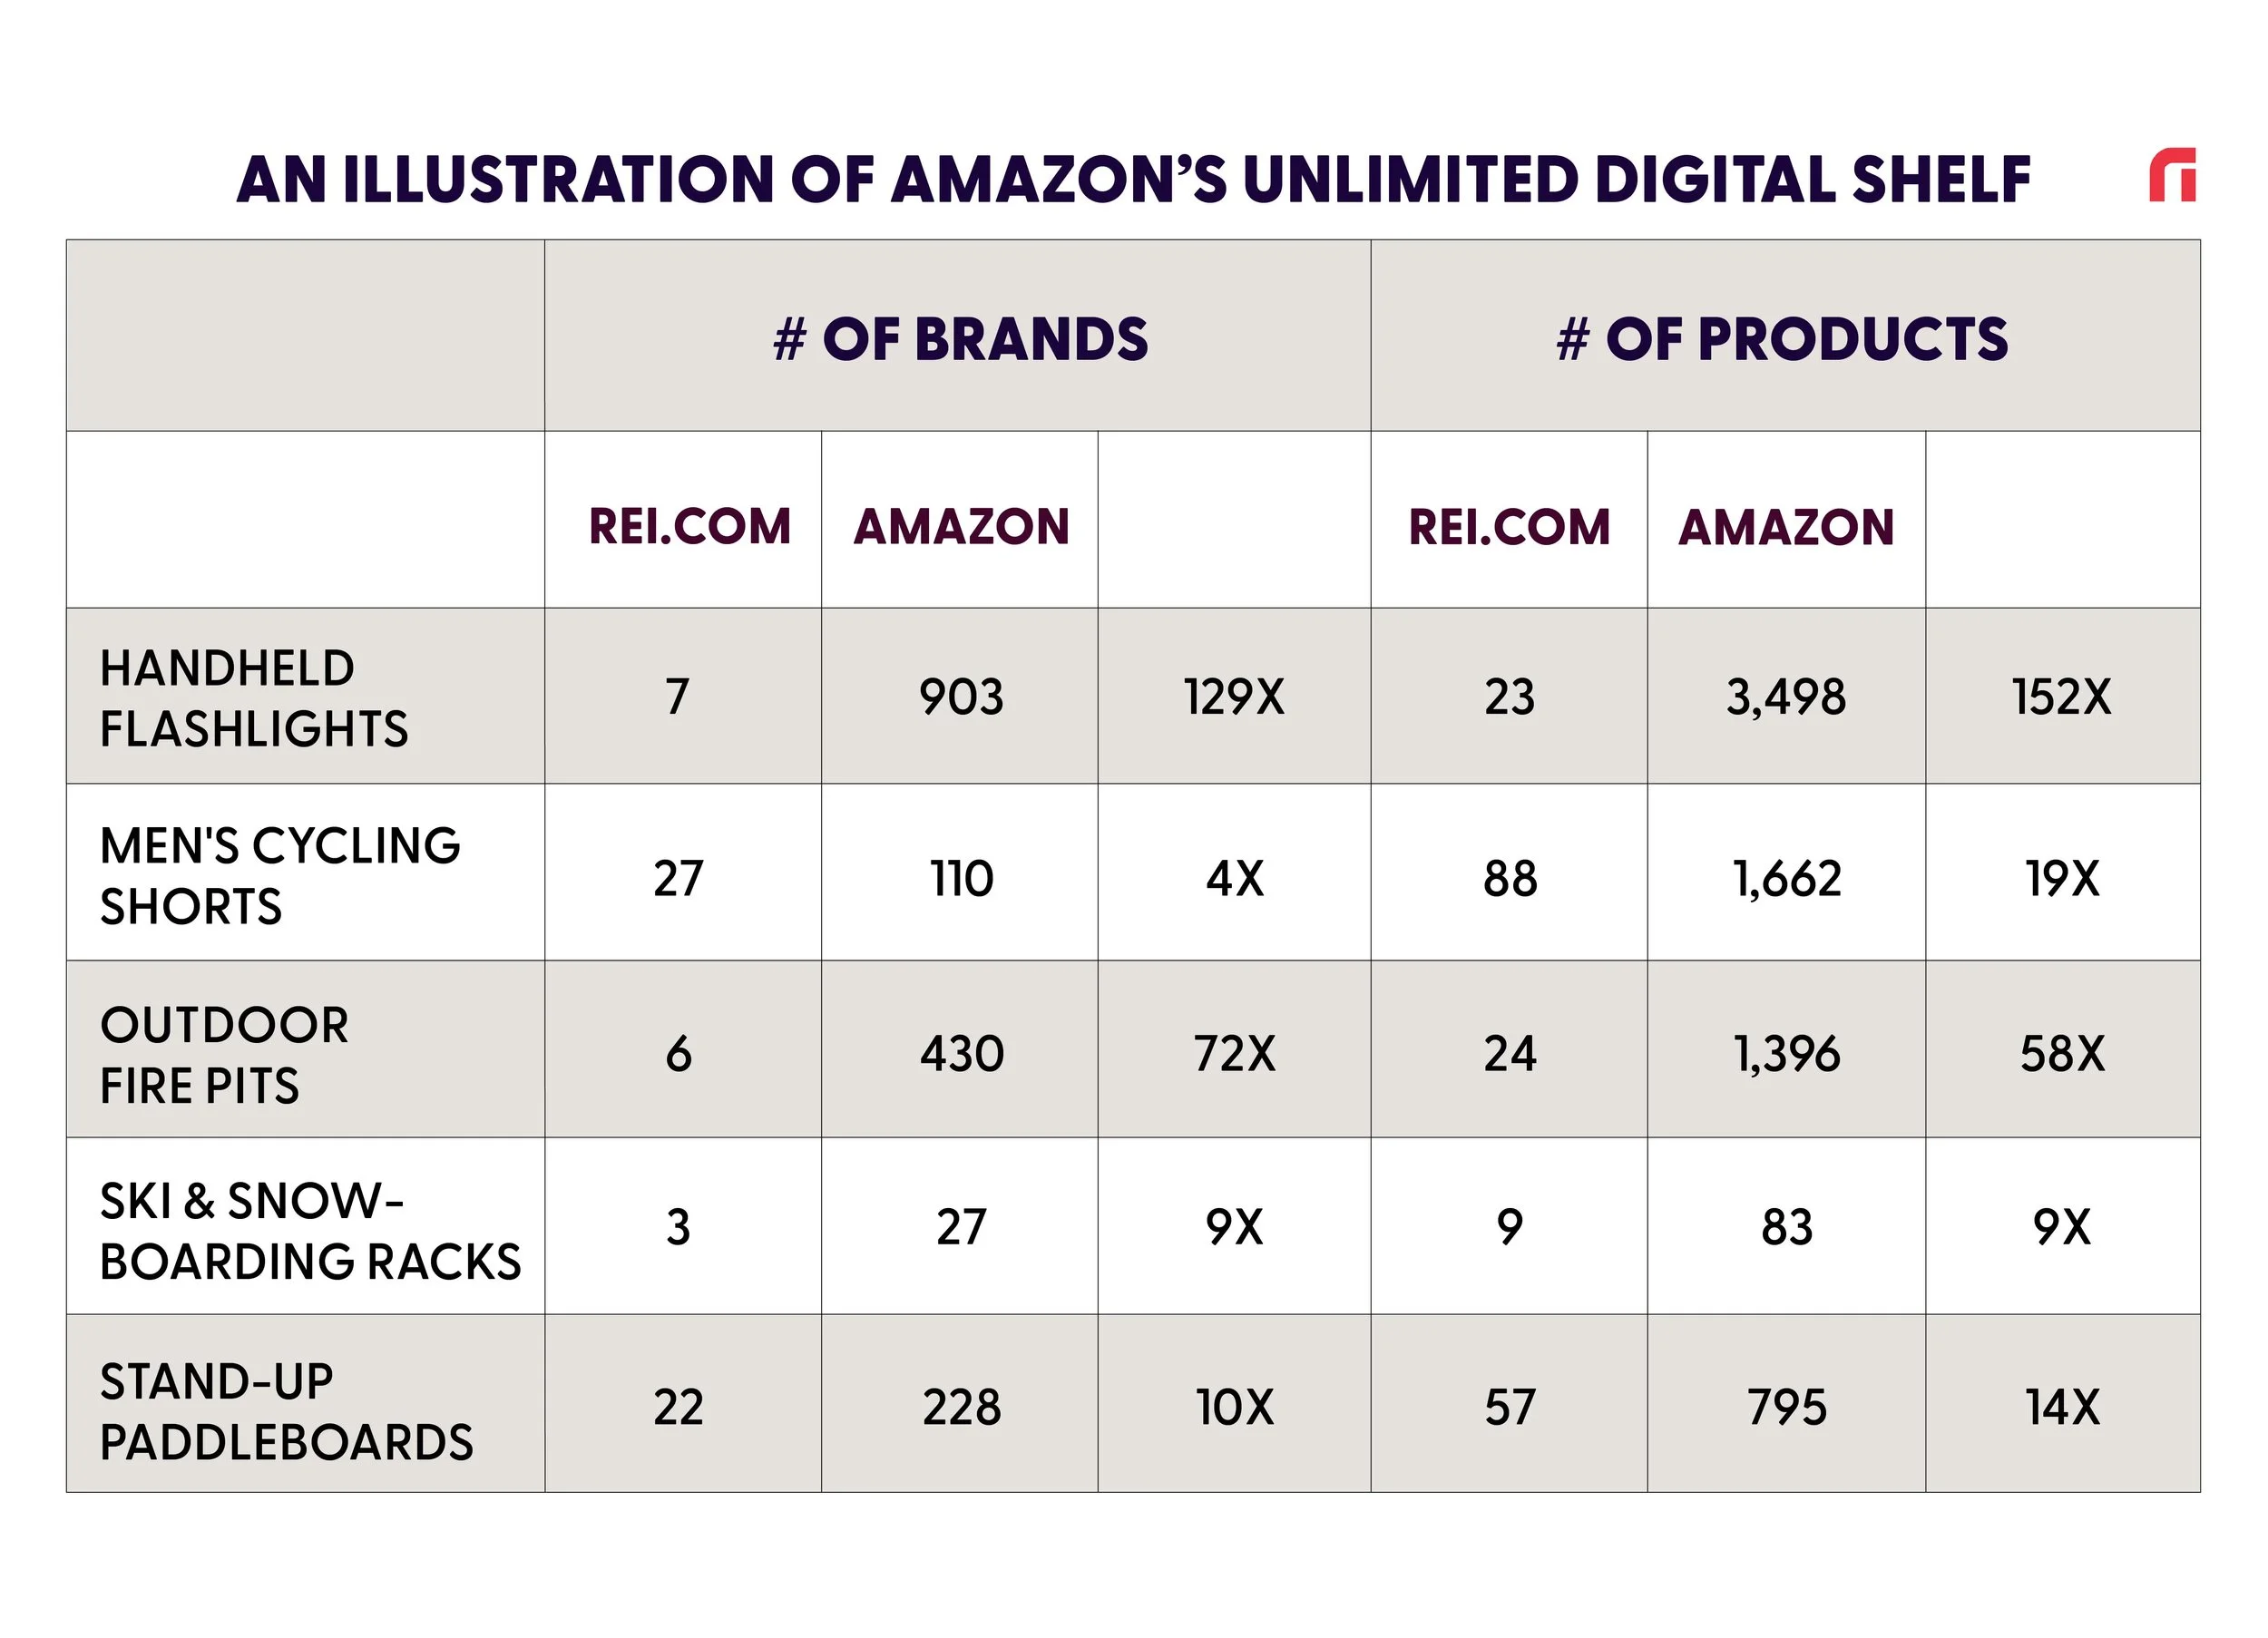
With Amazon comes an unlimited shelf. This can be positive, as there is always room for your next product. However, competitors have access to the unlimited shelf as well. Given the limited shelf space in B&M, a brand can typically count on growth as long as they have secured a spot on the shelf and the broad category grows. In contrast, as low barriers to entry continue to bring more brands into the Amazon ecosystem, brands face more competition. The levers above serve as the best defense against new entrants.
We set out to better understand this nuance by comparing the number of Sports & Outdoor brands and products on Amazon to REI.com. As shown in our sample below, brands can find themselves competing against anywhere from ~4x the amount of brands or products they are used to, all the way up to 100x or more in categories like handheld flashlights, where barriers to entry are extremely low.
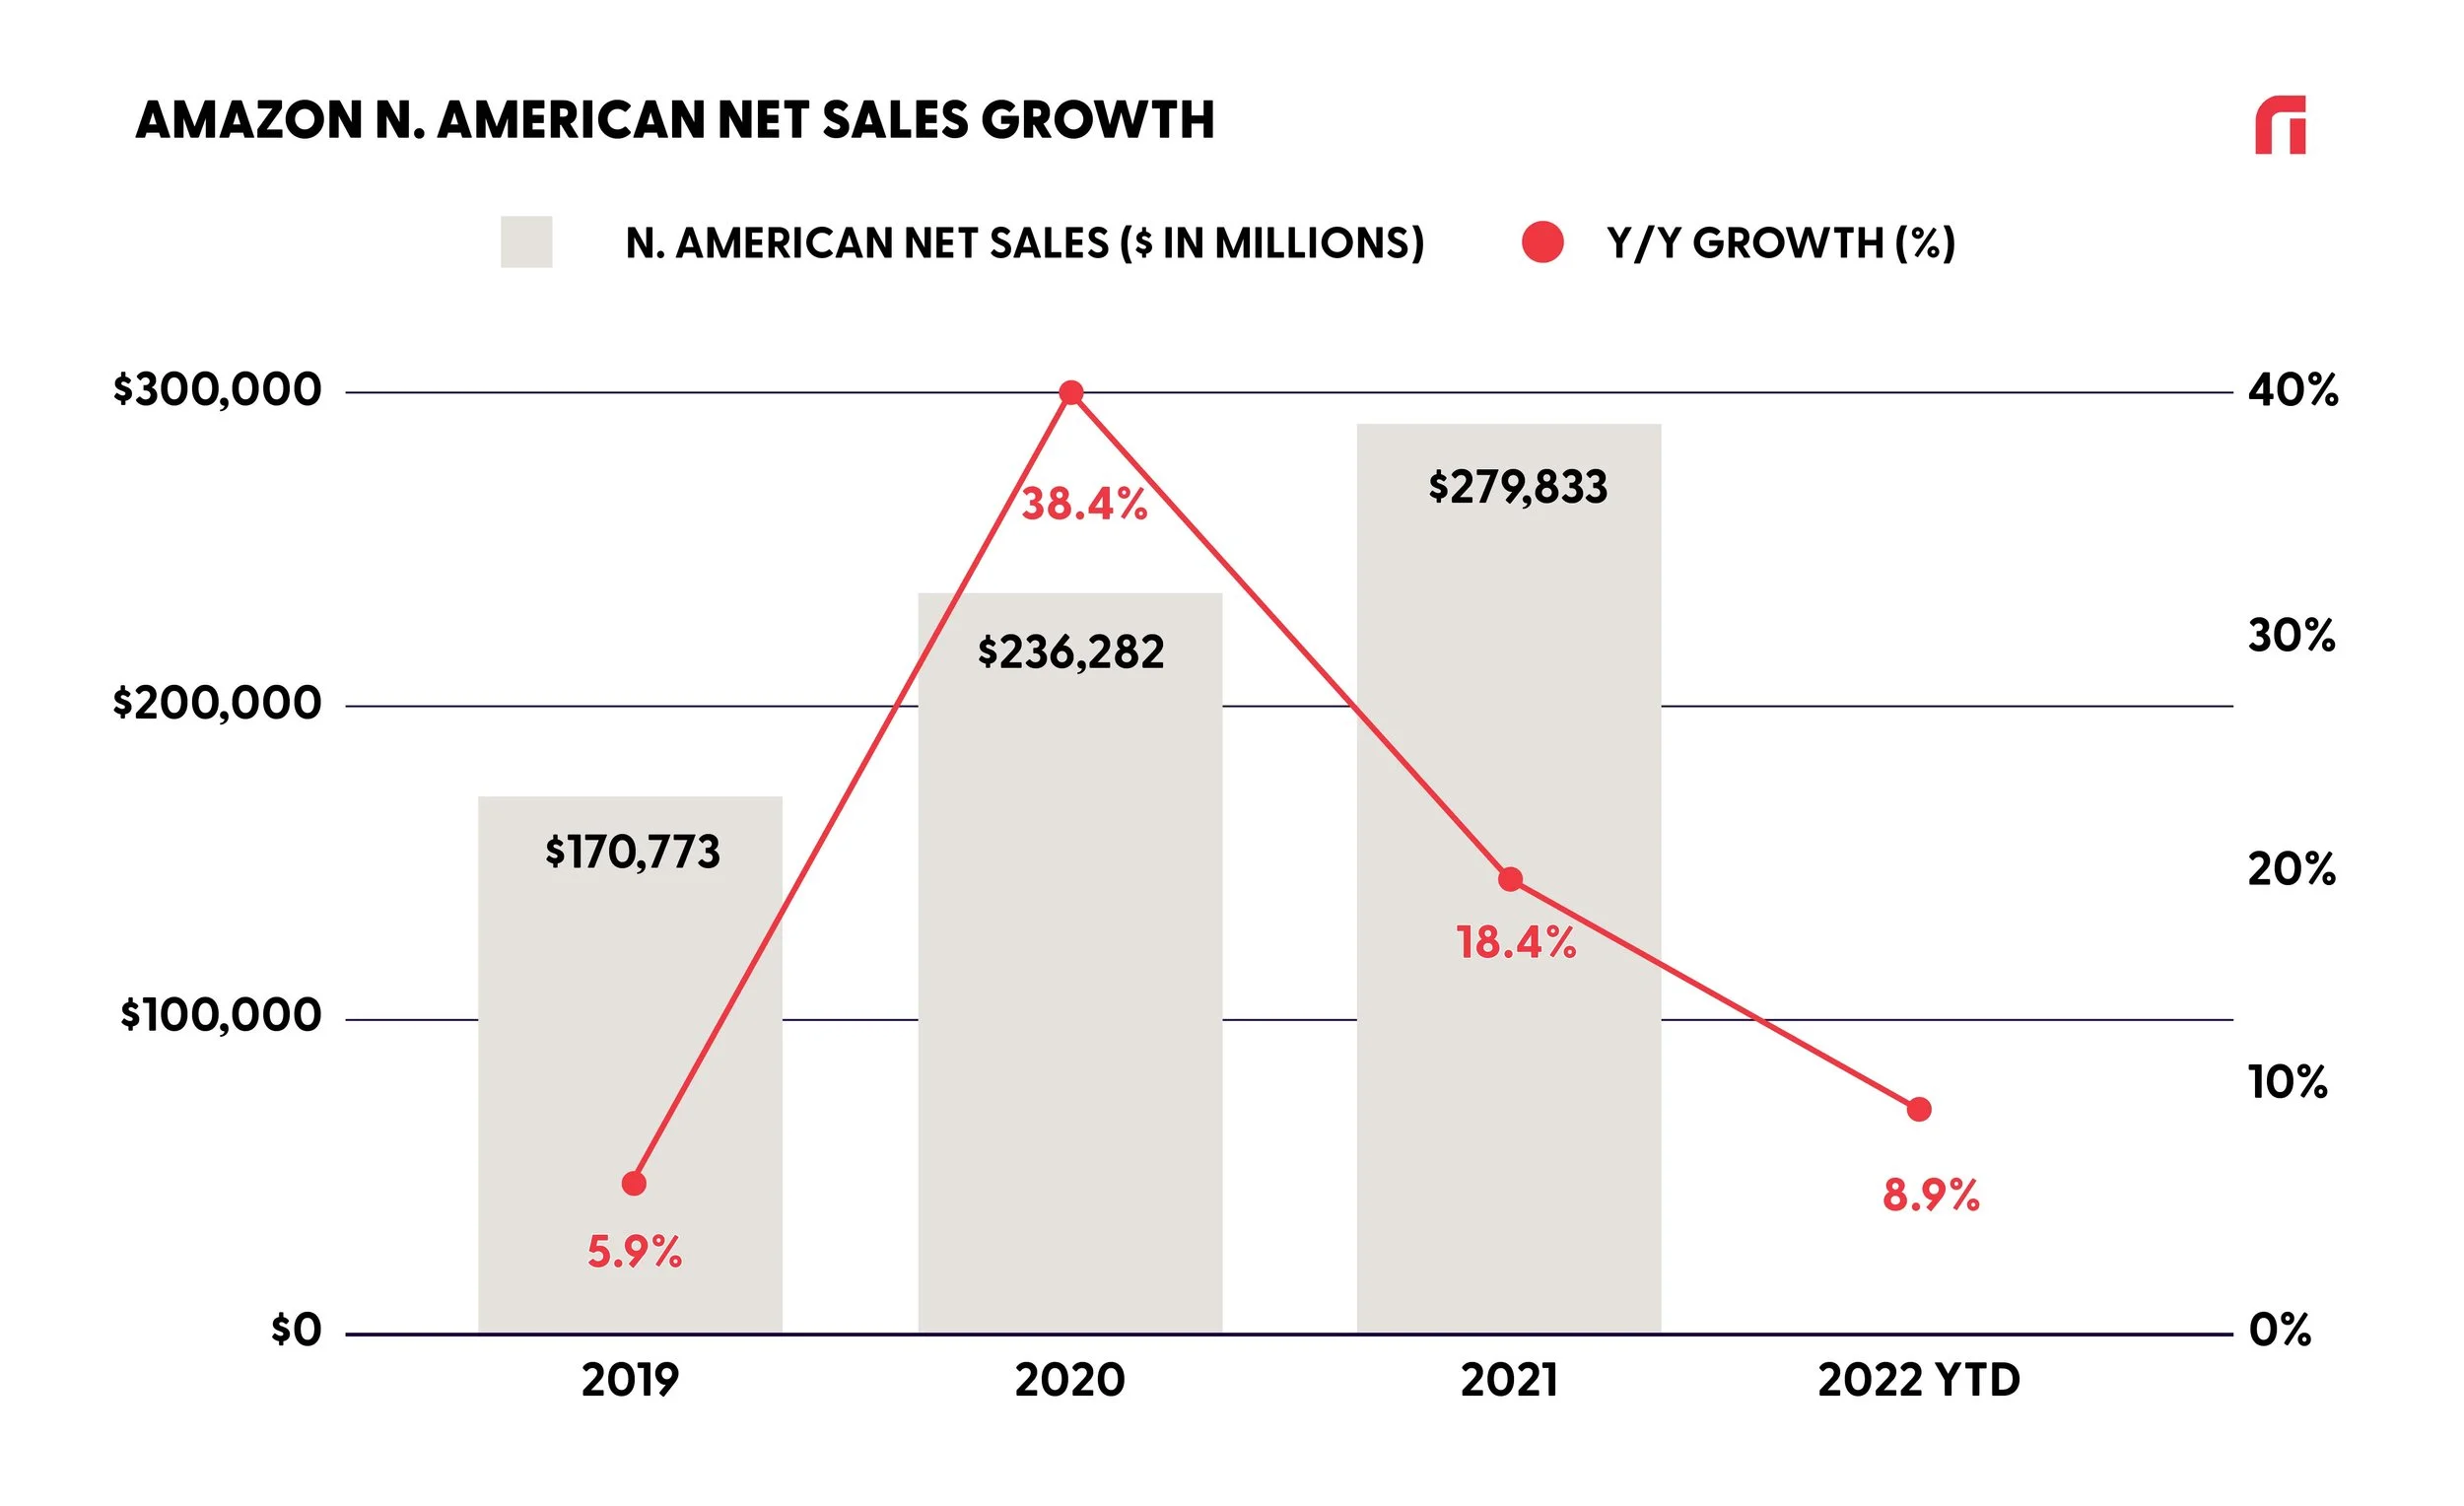
In many cases, Amazon (and ecommerce more broadly) experienced the most significant year-over-year growth during the pandemic years vs. B&M businesses. When forecasting 2022 and 2023 growth, it is critical to keep in mind prior year growth rates and how large the sales base has become, and to acknowledge that a steady continuation of pandemic-driven growth trends is unrealistic for most brands.
For context, Amazon reported North American net sales growth of 38% in 2020 and 18% growth in 2021. Those figures compare to just 6% growth pre-pandemic in 2019. Year-to-date in 2022 (1Q and 2Q), growth has decelerated to 9%. Even though growth rates impressively stand above pre-pandemic levels, this relative deceleration can be expected given Amazon is now lapping those high double-digit, pandemic-driven growth rates from 2020 and 2021.
“As a reminder, our revenue growth accelerated to over 40% growth from the period between May 2020 and May 2021. While demand has remained strong, the lapping of this high-growth period depressed our revenue growth rate for the following 12 months, ending in May of this year.”
While these figures encompass the total retail business and not Sports & Outdoors exclusively, it can be helpful in understanding how the relatively tougher comparisons may impact growth this year and beyond. Note that in some cases, this high-growth time period Amazon references may skew later for Sports & Outdoors brands, given the focus on essentials (versus discretionary) at the start of the pandemic by both Amazon and consumers.
5. On Amazon, brands have more visibility into sell-through trends. We see the best-in-class Brandrunners being acutely aware of sell-through—and aiming to stabilize it—rather than being only concerned on sell-in to B2B customers. Sell-through reflects trends among the end consumer which we believe is what business decisions should ultimately be centered around. Over-indexing to sell-in can cause “bullwhip effects” in the supply chain as many brands experienced during the pandemic years, along with other potential issues.
Thus, we recommend Brandrunners keep both KPIs in mind with regards to the forecasting process.
START SIMPLE WITH A FEW KEY INPUTS TO FORECAST
Now that we’re grounded in an understanding of the differences between Amazon and other parts of the retail business, we can move forward with forecasting. If all the nuances and levers described above were used as inputs or assumptions to the forecast, it would quickly and significantly increase forecasting complexity and decrease forecast accuracy and reliability. Rather, we recommend using a handful of critical inputs to build your forecast, and keep those levers at your disposal as the tools to help you achieve the forecast.
“It can become really complicated if you get into the weeds on different marketing metrics and other assumptions. I think there is something to be said for forecasting with just a few topline inputs and clear assumptions rather than estimating your end sales figures with a string of inputs and dependencies that are impossible to predict.”
Below are the four key inputs we most commonly turn to when building forecasts with our brands:
TRAFFIC
How many consumers are coming to my product detail page(s)?
Your historical traffic data is the best place to start for this. From there, changes to traffic come primarily from swings in advertising spend (impacting your visibility on the search engine results page (SERP) driving traffic from competitors' pages to your own), or changes to consumer demand (with real-time consumer search data helping to inform).
Other drivers can be harder to forecast, such as changes to organic ranking (slower effects, harder to quantify) and off-Amazon traffic-driving efforts (typically hard to forecast); therefore, use those activities as levers to pull rather than forecast assumptions. For new product launches, plan for a slow traffic build.
CONVERSION
How well can I convert the consumers that visit my product detail page(s)?
In most cases, historical conversion rates are a reliable input into forecasts. Brands can always work on improving conversion rates through initiatives like content changes, generating positive ratings and reviews, and broad-based brand building, but those are the types of levers that build slowly and are difficult to quantify in a forecast.
Conversion rates on new products likely start out lower than existing assortment given less robust ratings and reviews.
PRICE OR AOV
At what price are my customers converting?
Here is where we start getting to actual dollar figures in the forecast. If forecasting at the product level, use average price for this input. Be sure to keep in mind promotional activity and planned price increases, if applicable.
If forecasting at the category or brand level, it may make more sense to use average order value (AOV) as the key input. Similar to the above inputs, historical data is the best starting place here, also factoring in any planned changes to promotions or price. Cross- and up-selling activities can be used as levers to help increase AOV over time.
BUYBOX
How much of sales are being captured by me (or my authorized reseller)?
The concept of the buybox comes from Amazon’s marketplace model and is one of the most meaningful nuances between Amazon and traditional B&M. Because there could be a number of third-party sellers offering your brand's products, every sale made on the platform does not necessarily get captured on your Amazon P&L. In nearly all cases, the buybox winner (see image below) captures the sale. The buybox is algorithmically powered, primarily factoring in price (favoring the lower price for consumers) and fulfillment (favoring Prime delivery). The rate at which you (or your authorized reseller) achieve the buybox is your buybox rate.

When forecasting, start by using historical buybox rates.
It's important to note that even if you didn't win the buybox on a given Amazon sale, the brand still made that sale somewhere (except for less common instances, such as shoplifted or counterfeit product). For example, a distributor partner could have purchased from the brand and then sold to a gray market seller, or someone could have bought the product on sale off another retail shelf and then listed and sold that product through Amazon.
As it relates to forecasting, the issues are 1) these types of sales often happen at a lower price and 2) they create misleading internal P&Ls; for example, distribution partners offloading to the gray market will artificially inflate distributor sales while artificially deflating Amazon sales, which has implications for marketing funds, internal staffing, and more. (There are a host of other issues less directly related to forecasting, such as less control over brand presence and customer service, among others.) Thus, it's imperative for Brandrunners to be working towards a "clean" marketplace, which can require holistic promotional strategies and incentive structures, and legally-bound and enforced pricing and reselling policies. These types of actions will improve buybox over time and therefore your captured Amazon sales.
HISTORICAL SEASONALITY TENDS TO HOLD TRUE
In our experience forecasting and executing the Amazon business alongside many Sports & Outdoor brands, historical seasonality tends to hold quite well. Thus, in another effort to keep it simple, we recommend starting with a full-year forecast and then applying historical seasonality trends to help get to quarterly and monthly forecasts.
BUILD SMART FORECASTS, SET BIG GOALS
There can be a fine balance between smart forecasting and setting big goals. Given the forecast will ultimately drive inventory decisions, it’s important to not be overly aggressive. As an example, many brands and retailers saw consumer demand spike in 2021 and forecasted that the trend would stay steady through 2022. Those aggressive forecasts, coupled with limited visibility into a challenging supply chain environment, have led to some to end up over-inventoried this year.
At the same time, leaders don’t want to forecast so conservatively that they put a ceiling on growth and demotivate their teams. Thus, we believe Brandrunners can have a smart forecast, and a separate, bigger goal to shoot for. When we work with brands in this manner, the forecast is what is likely to happen based on the key inputs covered above. We’ll then work together to solidify a bigger goal, along with a thoughtful plan to get to that goal, based on all of the levers brands have to pull on Amazon.
NETRUSH EXPECTATIONS FOR THE SPORTS & OUTDOORS INDUSTRY
To help quantify overarching Sports & Outdoors growth trends, we turned to an index of eight brands and retailers within the industry with publicly-available financials. This index, that we’ll use as a proxy for the broader U.S. Sports & Outdoors industry (both B&M and ecommerce), was trending in the mid-single-digit range for growth prior to the pandemic.
Growth decelerated to roughly 3% in 2020, likely driven by a combination of 1) the large majority of the business primarily being done through B&M, which halted for some time during the pandemic, 2) supply chain challenges driving out-of-stocks, and 3) consumers’ prioritization of essential goods for a portion of time.
The business then accelerated significantly to an estimated 33% growth in 2021 as the headwinds of 2020 eased: B&M opened back up, traditional retailers also ramped up ecommerce offerings, and consumers’ relied on the great outdoors to stay active and physically and mentally healthy, aided by government stimulus checks.
We forecast growth to end up in the low- to mid-teens range for 2022. Our consumer search trends index, which analyzes Google search trends for a wide mix of Sports & Outdoors search queries, suggests consumer interest in the category remains healthy, at or above 2021 and pre-pandemic levels.
Going forward, we expect industry growth rates to continue to normalize back to pre-pandemic levels of mid-single digits.


For Amazon and ecommerce specifically, our research suggests digital penetration has come down since the peak of the pandemic, but still remains higher than pre-pandemic levels. We expect digital penetration to continue to expand, albeit much more slowly than it did in 2020 and 2021. Accordingly, we believe Amazon and ecommerce are likely to grow faster than B&M, acknowledging there may be a period of “normalization” in which ecommerce growth rates could drop lower than B&M.
This relates to the #4 Amazon nuance covered above and is why brands’ Amazon forecasts for 2022 and 2023 could be individually unique, based on how 2020 and 2021 growth rates were influenced by Amazon’s prioritization of essentials, brands’ supply chain and inventory situations, and their unique consumer demand. Thus, we recommend Brandrunners refer back to 2019 penetration and growth levels as helpful benchmarks before pandemic-driven noise kicked in, with the general benchmark being that penetration likely normalizes at a slightly higher level compared to 2019 and continues to expand slightly in the outyears as well.
HERE’S WHAT BEST-IN-CLASS BRANDRUNNERS DO AFTER THE FORECAST IS BUILT
Greater access to data and levers via the Amazon platform (compared to traditional B&M) means Brandrunners have a greater ability to actively work towards achieving their forecasts. To take full advantage of those benefits, it’s important to regularly revisit your forecast, understand how you are tracking against it, and understand what may be driving any over- or under-performance relative to forecast. From there, you can open your toolbox of levers we covered above to make adjustments to the business that help meet (or exceed!) the forecast.
For example, Netrush does this exercise once weekly, at a minimum, to place dynamic purchase orders with our brand partners based on real-time data. Additionally, we revisit the forecast with Brandrunners on a monthly and quarterly basis.
“An important part of forecasting is understanding that you’re going to be wrong! You’ve got to know that, know where your risks are within the forecast, and then actively monitor and manage against the forecast.”
It’s important to regularly communicate cross-functionally and with external partners, especially when there is a large deviation from forecast or when any business action may significantly affect outcomes.
In the simplest example, production and supply chain teams need the latest and greatest forecast to ensure healthy inventory levels. On the flip side, if the supply chain runs into new delays or challenges that will impact in-stock levels, those need to be communicated back to the Amazon team so that forecasts can be adjusted accordingly, along with subsequent adjustments such as pulling back advertising spend. B&M activities such as a large promotional event should be shared across channels as there are likely to be trickle down effects on the Amazon business.
Successful Brandrunners—and their brands—set themselves apart by being data-driven and fast-moving with a clear understanding of modern commerce growth levers, as well as leading cross-functional collaboration and communication throughout the organization.
LEARN HOW NETRUSH CAN HELP YOU FORECAST SMARTER
Through a Netrush partnership, we work hand-in-hand with Brandrunners to forecast and execute their Amazon business, leveraging our powerful data, our Sports & Outdoors category expertise, and our comprehensive operating system that seamlessly integrates sales, supply chain, advertising, insights, and more.
Netrush data and insights can help you forecast your Amazon business with more precision and confidence. From consumer search trends, to market share data, to growth benchmarking, and more, we equip Sports & Outdoors Brandrunners with the insights they need.
To see these data sets at the category level or to explore a Netrush partnership, email michele.flamer-powell@netrush.com.
ABOUT THE SERIESWe’re keeping up the momentum of The Big Gear Show with a limited series for Sports & Outdoors leaders. At the show, we heard Brandrunners sharing uncertainties and challenges related to recessionary impacts, cost pressures, and more. This series provides tangible tools, data, and perspective to help Brandrunners solve those challenges and subsequently gain control and maximize profits in today’s complex retail landscape.
Visit the content series landing page.
ABOUT THE AUTHORClaire McBride leads research, insights, and education for Netrush. She has spent the last five years helping brands grow and optimize their ecommerce businesses through written research, events, share group discussions, and one-on-one consulting, formerly with Cleveland Research Company before joining the Netrush team.